3D TOMOGRAPHIC STRUCTURE OF THE UPPER MANTLE BENEATH
THE CENTRAL PART OF THE EUROASIAN CONTINENT
Ivan Kulakov
United Institute of Geology, Geophysics and Mineralogy,
Siberian Branch of Russian Academy of Sciences.
3, University Ave., Novosibirsk, 630090, Russia.
E-mail: ivank@uiggm.nsc.ru
Phones: (3832) 351444, 355832 (home)
Introduction
Seismic tomography is the most powerful instrument for determination of
3D structure of deep Earth's interiors. Tomographic models obtained at the global
and regional scales serve as the basis for determination of geodynamical state of
the Earth. The global tomographic models (Dziewonski, 1984, Woodhouse and
Dziewonski, 1984, Su et al., 1994) have evident correlation with other
geophysical and geological characteristics (geoid, thickness of the lithosphere,
relief) that proves some theoretical geodynamical speculations based on numerical
and physical modelling (Hager and Richards, 1989). The same situation takes
place in the regional modelling. For example, tomographic model of Europe
obtained by Spakman et al, 1993, clearly shows all perculiarities predicted by
geologists (existence of slabs, root of mountains, spreding) and also gives
fundamentally new possibilities for investigation of the actual geodynamical state
of the region and to trace the history of its development (De Jonge et al., 1994).
Unfortunately there are only few regions where the regional tomographic
models of the upper mantle were obtained. Mostly these regions are coinciding
with centers of technical civilization and, at the same time, of high seismological
activity: Europe (Spakman et al., 1993), west of the North America (Humphreys
and Dueker, 1993), Asia Minor (Hearn and Ni, 1993), Eastern Pacific (Puspito et
al., 1994) etc. But most of the Earth's territory is not yet studied satisfactorily.
The center of the Euroasian continent is very interesting region from
geological point of view. On the one hand it is the center of the largest continent
and such location should definitely determine the structure of flows in the
mantle, on the other hand a great collizion zone connected with closure of
Paloasian ocean (Sengor et al., 1995) is associated with this area. Manifestations
of recent tectonic activities, like as Baikal rift zone, orogenesis, high seismisity,
take place within this inner plate region.
The attemptions to obtain an information about mantle structure under this
territory was mounted by several authors since 60th. First quantitative
tomographic model was obtained by Alekseev et al., 1971
The seismic structure of the upper mantle beneath a broad area located in
the center of Euroasian continent is described in the paper. This area includes
such tectonicly active regions as: Altai and Sayan orogenic areas, Baikal rift
zone, western part of Mongoly and North-Western part of China (Fig.1). A part
of this area (Altai-Sayan region) was studied in our recent investigation (Kulakov
et al., 1995). A large negative seismic anomalies was obtained under the regional
depression of Ubsu-Nur lake and under Hubsugul lake. These anomalies were
interpreted in the paper as hot, ascending flows On the contrary, the mountain
areas of Altai and Sayan was associated with positive anomalies in the upper
mantle interpreted as descending cold flows. However this tomographic model
was obtained in condition of very poor data, when the level of noise was higher
than the relevant residuals. Therefore the problem of reliability of these results
was very sharp. In spite of several tests made in the work, destined to prove the
validity of the model, there was many doubts with regards to fairness of the
conclusions proposed. We confessed in the paper that only a verification using
independent data could prove more or less definitely the reliability of the
obtained configuration of anomalies. The main aim of the actual research is
verification of the recent tomographic model (Kulakov et al., 1995), and, in the
case of success, expanding of the research to the adjacent areas. In so doing, the
key problem was the following: which data we can use?
Problem of the Data
More than 20 permanent, stationary seismic stations registering the
information both on local and telesesmical events are situated on the territory of
Altay-Sayan region. However, application of the information about far sources
registered at these stations is connected with many difficulties which made our
recent research (Kulakov et al., 1995) problematic.
First, these data are stored "on the paper". Their selection is hard manual
work expanding the time of realisation of research to the years. In addition,
when the adjacent territories were studied, the information is often stored in
different towns and it is practically impossible to get them into computer readable
form.
Second, record of the seismograms at the stations is occured by old,
analogue equipement, interpretation of the seismograms is manual, that cause
significant errors of phase determination and travel time calculation.
Third, small number of the stations and their uneven distribution in the
region make the study of the upper 100-200 km impossible, since the rays from
differend stations do not form there sufficient system of intersections.
There was attempts to apply the data on the travel timef from local events
registered by regional seismological network. But, as was apparent, the Altai-
Sayan Seismological Expedition, which is responsible for processing of all
seismological information in Altai-Sayan region, takes into accont only, so called,
direct waves, passing in the crust, that is convinient for study of hypocentral
parameters of a source, but does not give absolutely an information about
subcrustal structure.
All these reasons have sent us to break with application of the regional
seismological network data and to invoke methods applying the data of world
seismological network allowing extraction of a relevant information on interiors
of the region under study. One of the such methods is:
Inverse Teleseismic Scheme (ITS)
An essence of ITS is based on utilization of travel times of the rays from
events located within a region under study registered at the stations of world
seismological network. All this information is stored at the servers of ISC and
can be easily taken by everyone for any region. In particular, for Altay-Sayan
region we have about 200 events registered by more then 1000 station. High
number of stations registering one event and high number of events registered by
one station allow a precize calculation of the source and receiver corrections.
The stations of world seismological network equiped by instruments of high
quality, and it allows the calculation of travel times of necessary phases to a
higher precision than that at regional stations.
A dense distribution of sources within the study region allows the itersection
of rays from different ray tubes at the shallower depths in comparison with
traditional teleseismic scheme, that permits us to obtain a relevant information
above the 100 km in depth.
ITS allows the study of any tectonicly active region, beyond the dependence
on technical state of the regional seismological service (and even in the case of
its absence) avoiding permissions of local authorities.
It has been this scheme which has served as a basis of current research.
Data processing
Preliminary processing of the data has to do with all sources within the
study area (Fig. 1). The number of sources within the area used in the research is
about 500. About 2000 stations of the world seiemological network take part into
their registration. The total number of the rays available is about 36 000.
The processing of initial data begins with determination of an average
travel-time curve for the total set of data. A problem of determination of a
reference model for the study region corresponding to this travel-time curve did
not occupy our attention, since, as the experience of teleseismic research implies
(Kulakov et al., 1995), variation of a reference model, especially in its upper
part, has not a marked effect on the result of teleseismic inversion.
The reference travel time curve was approximated by a polynom of L-th
order. In the region from 20* to 93*, corresponding to the rays passing through
the lower mantle and not entering to the core, the travel-time curve of refracted P
waves, which is quite smooth, is well described by the order L=6. The
calculation of these decomposition parameters is made by the Least Squares
Method.
Here, as in the traditional teleseismic scheme, the relevant residuals are
presented as:
where is real travel time
is travel time according the reference curve
is receiver (station) correction,
is source correction. Source and receiver corrections are determined from a
minimum condition of residual norm: . The station correction
includes all error factors superimposed on the travel time of a ray between the
station and bottom border of the study volume: anomalies in the mantle and the
lithosphere and relief beneath the station, errors of reference model determination
etc. The source corrections includes errors connected with the sources and the
uppermost region under them: error of hypocenter depth determination,
anomalies in the crust etc.
Preliminary estimation of these correction is made by simple averaging of
travel times relatively refenence travel-time curve:
The further, more accurate determination of the source and receiver
corrections is occured on the assumption of munimum of norm , that is
realized by SVD decomposition.
When processing the data and searching of the source and receivers
corrections, the selection was made only over the sources registered by no less
than N stations, and receivers registering no less than M sources. In our case the
value of N and M was correspondingly 25 and 10.
The next processing was made over separated fragments of the region, but
the data obtained for the whole area were used as the residuals.
Percuilarities of inversion technics.
Here, as in the vast majority of practical tomographic investigations, the
inversion was based on the matrix representation:
where is the data vector, is the matrix of the first derivatives ,
is finit set of unknown parameters describing the velocity distribution in the
study volume. As in our previous research, the parameterization of the model
(method of representation of velocity distribution within the study area by finit
number of parameters) was made by Vertex Method described in (Kulakov et al.,
1995). Here this method is realized by subdivision of the study volume by
tetrahedral sells with constant gradient of a velocity parameter (velocity, or
slowness, or squared slowness). Such approximation allows continuous velocity
distribution within the study volume. The values of velocity variations at the
vertices of these tetrahedral blocks play the role of unknown parameters. The
direct problem of ray tracing in such media is described in (Cerveny, 1991).
An important perculiarity of our method of parametrization consists of
coordination of the density of input and output information which is realized by
determination of a sell size according to the density of the rays. Automatic
algorithms allowing such construction were developed in the actual research. The
coordination of input and output information allows the uniform filling of rows
of A-matrix by nonzero elements, that significantly improves its quality and,
correspondingly, increases stability of inversion toward the random noise. The
advantages of such method of parameterisation are described in (Kulakov et al.,
1995). In particular, it was noted that such way allows stable reconstruction of
anomaly even if the noise in the data is two time higher than the relevant signal.
The tests showing the advantages of such coordination in comparison with
uniform grid are shown in the chapter "Verification of the results and tests".
The inversion of the A-matrix was made by the Singular Value
Decomposition (SVD) method. The criteria for determination of optimal quantity
of singular numbers, which play the role of regularization parameter, were
developed in the paper (Kulakov and Druzhinina, 1996).
Results
The calculation of velocity structure in the upper mantle was made within
separated regions covering the study territory and overlaping partially one
another. That allowed us, on the one hand, to operate with fairly small matrix
(300x3000 elements) which can be inverted by the SVD method, and, on the
other hand, it give us another way of verification of the obtained results by
comparison of anomaly configuration in the overlaping ares. ITS permits a
movement from one fragment to another along all tectonically areas with
sufficient number of earthquakes registered at the world seismological network.
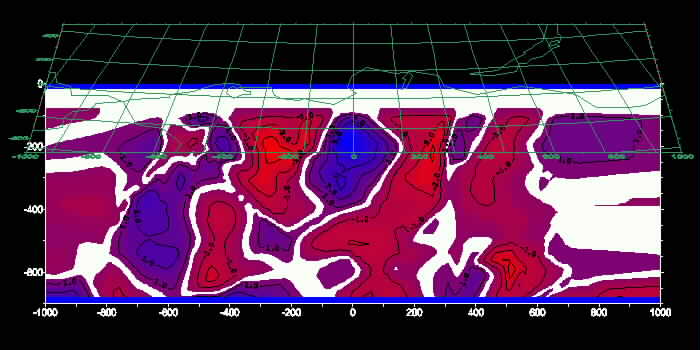
The obtained velocity model is given in Figures as set of vertical
sections, whose location is shown in the firure . Dark areas mean the negative
seismic anomalies.
Comparison with configuration of anomalies obtained in (Kulakov et al.,
1995) shows fairly good correlation of these two models, obtained by different
approaches with absolutely independent sets of data. In the both models large
negative anomalies are associated with a large depression in the area of Ubsu-
Nur lake and with Hubsugul lake. In the contrary, large positive anomalies are
observed beneath the mountain areas of Altai and Sayan. Such correlation proves
evidently the general conclusions made in our previous paper.
Verification of the results and tests
Good correlation of the obtained models in the overlaping areas between
different fragments as well as satisfactory agreement with the tomografic model
obtained latter attests the reliability of the obtained results, but to verify them and
to test the algorithm we used several tests.
Reconstruction with different grids. To study the influence of a
parameterization upon the result of velocity calculation different grids where
applied for the same region. In particular, an effect given by the coordination of
imput and output information was investigated by inversion with an uniform
grid. In the current research a triangulate grid with constant size of sells was
applied for the real data. The analysis of the matrix structure shows that the
condition numver in such case (a ratio between maximum and minimum
eigenvalues reflecting the quality of the matrix) was about 14000, while in the
case with coordination it was about 16. Correspondingly a more or less stable
solution in the first case was achieved when only 60-70 singular numbers were
used, while in the second case such stability was acheved at 110-130 singular
numbers. Results of inversion in both case (fig. ) evidently shows the
effectivity of our way of parameterization.
The parametrization by rectangular sells of uniform size were analized and
compared with triangulate grid with coordination at syntetic models in the paper
(Druzhinina and Kulakov, 1996). This research showed significant efficiency of
the vertix parameterization in comparison with traditional rectangular
parameterization.
A reconstruction of the same anomaly by use of the same type of grids, but
with different nunber of parameters is very important to show how the increasing
of parameter number can improve the resolution of a model. This question was
also studied in the paper (Druzhinina and Kulakov, 1996), and it was shown that
in the case of significant noise in the data, an increase of the number of
parameters does not improve the quality of the reconstruction, but even gives
significant nonstability and causes manifestation of falsh details.
Reconstruction with independent sets of data. In order to estimate the
influence of random noise in the data upon the final reconstruction, an
independent inversion of two independent groups of data was made. All events
was separated by a random criterium (with odd and even numbers) and the all
processing was made independently. The result of inversion (fig. ) shows a
significantly better correlation that in the same test made for model KTK95. That
means that the quality of data in this research is significanly higher.
Reconstruction with noised data. In order to show abilities of the algorithm
used in the actual research to give the useful information in condition of high
level of noise, an inversion both for syntethic (Druzhinina and Kulakov, 1996)
and real anomalies were made in the case of high level of noise. A configuration
of noise distribution was taken from (Spakman et al., 1993). Such reconstruction
was made for different types of anomalies and the results was generally
satisfactory.
</